
You lock in performance, cost, and lead time the moment you choose an alloy. Metallurgical factors drive 25–30% of sand casting scrap, and improper alloy composition sits among the causes. This professional English B2B educational article for Qingdao Xuxiangtai Machinery Manufacturing Co. gives you a structured evaluation sequence, written for Qingdao Xuxiangtai Machinery Manufacturing Co. buyers who want fewer surprises.
Key Takeaways
- Define your part's requirements first. This step guides every alloy choice.
- Compare alloys in a fixed order: properties, compliance, cost, castability, and testing.
- Bring your foundry into the conversation early. Early teamwork shortens the path to a qualified part.
Define Requirements Before Comparing Alloys
You cannot rank alloys without a fixed reference point. Write down the application requirements first, and every later comparison becomes a check against that list.
Mechanical Loads and Duty Cycle
Start with the loads the part will carry. Ask whether the casting will see high pressure, elevated temperature, repeated loading, vibration, or thermal cycling. Fatigue deserves special attention in cast parts. Micro-cracks typically begin at vulnerable geometric features such as edges, grow under continued cyclic loading, and reach a critical size that triggers rapid failure across the whole component. Temperature and pressure fluctuations, corrosion, and vibratory wear all accelerate this process. Record the target tensile strength and fatigue strength for your duty cycle, then compare candidate alloys against those numbers.
Operating Environment and Corrosion Exposure
Map the environment next. Saltwater, chemicals, abrasive materials, and corrosive fluids each set a different bar. Protective surface oxides explain much of the difference between alloy families.
| Material | Protection mechanism | Environmental limits and strengths |
|---|---|---|
| Stainless steel | Chromium forms a thin protective oxide layer | Strong in many environments; chloride-rich conditions remain a risk |
| Aluminum alloys | Naturally builds a protective oxide film | Resists atmospheric corrosion and many chemicals |
| Titanium | Extremely resistant to most corrosion forms | High cost limits use to specialized applications |
| Copper and bronze alloys | Dense, adherent surface layer slows reactions | Excellent resistance to moisture, salts, and industrial chemicals |
Temperature belongs in this step as well. Carbon steels lose structural capability at much lower temperatures than stainless steels and nickel-based alloys. Furnace, exhaust, and turbine parts need alloys that resist softening and creep.
Dimensional and Surface Tolerances
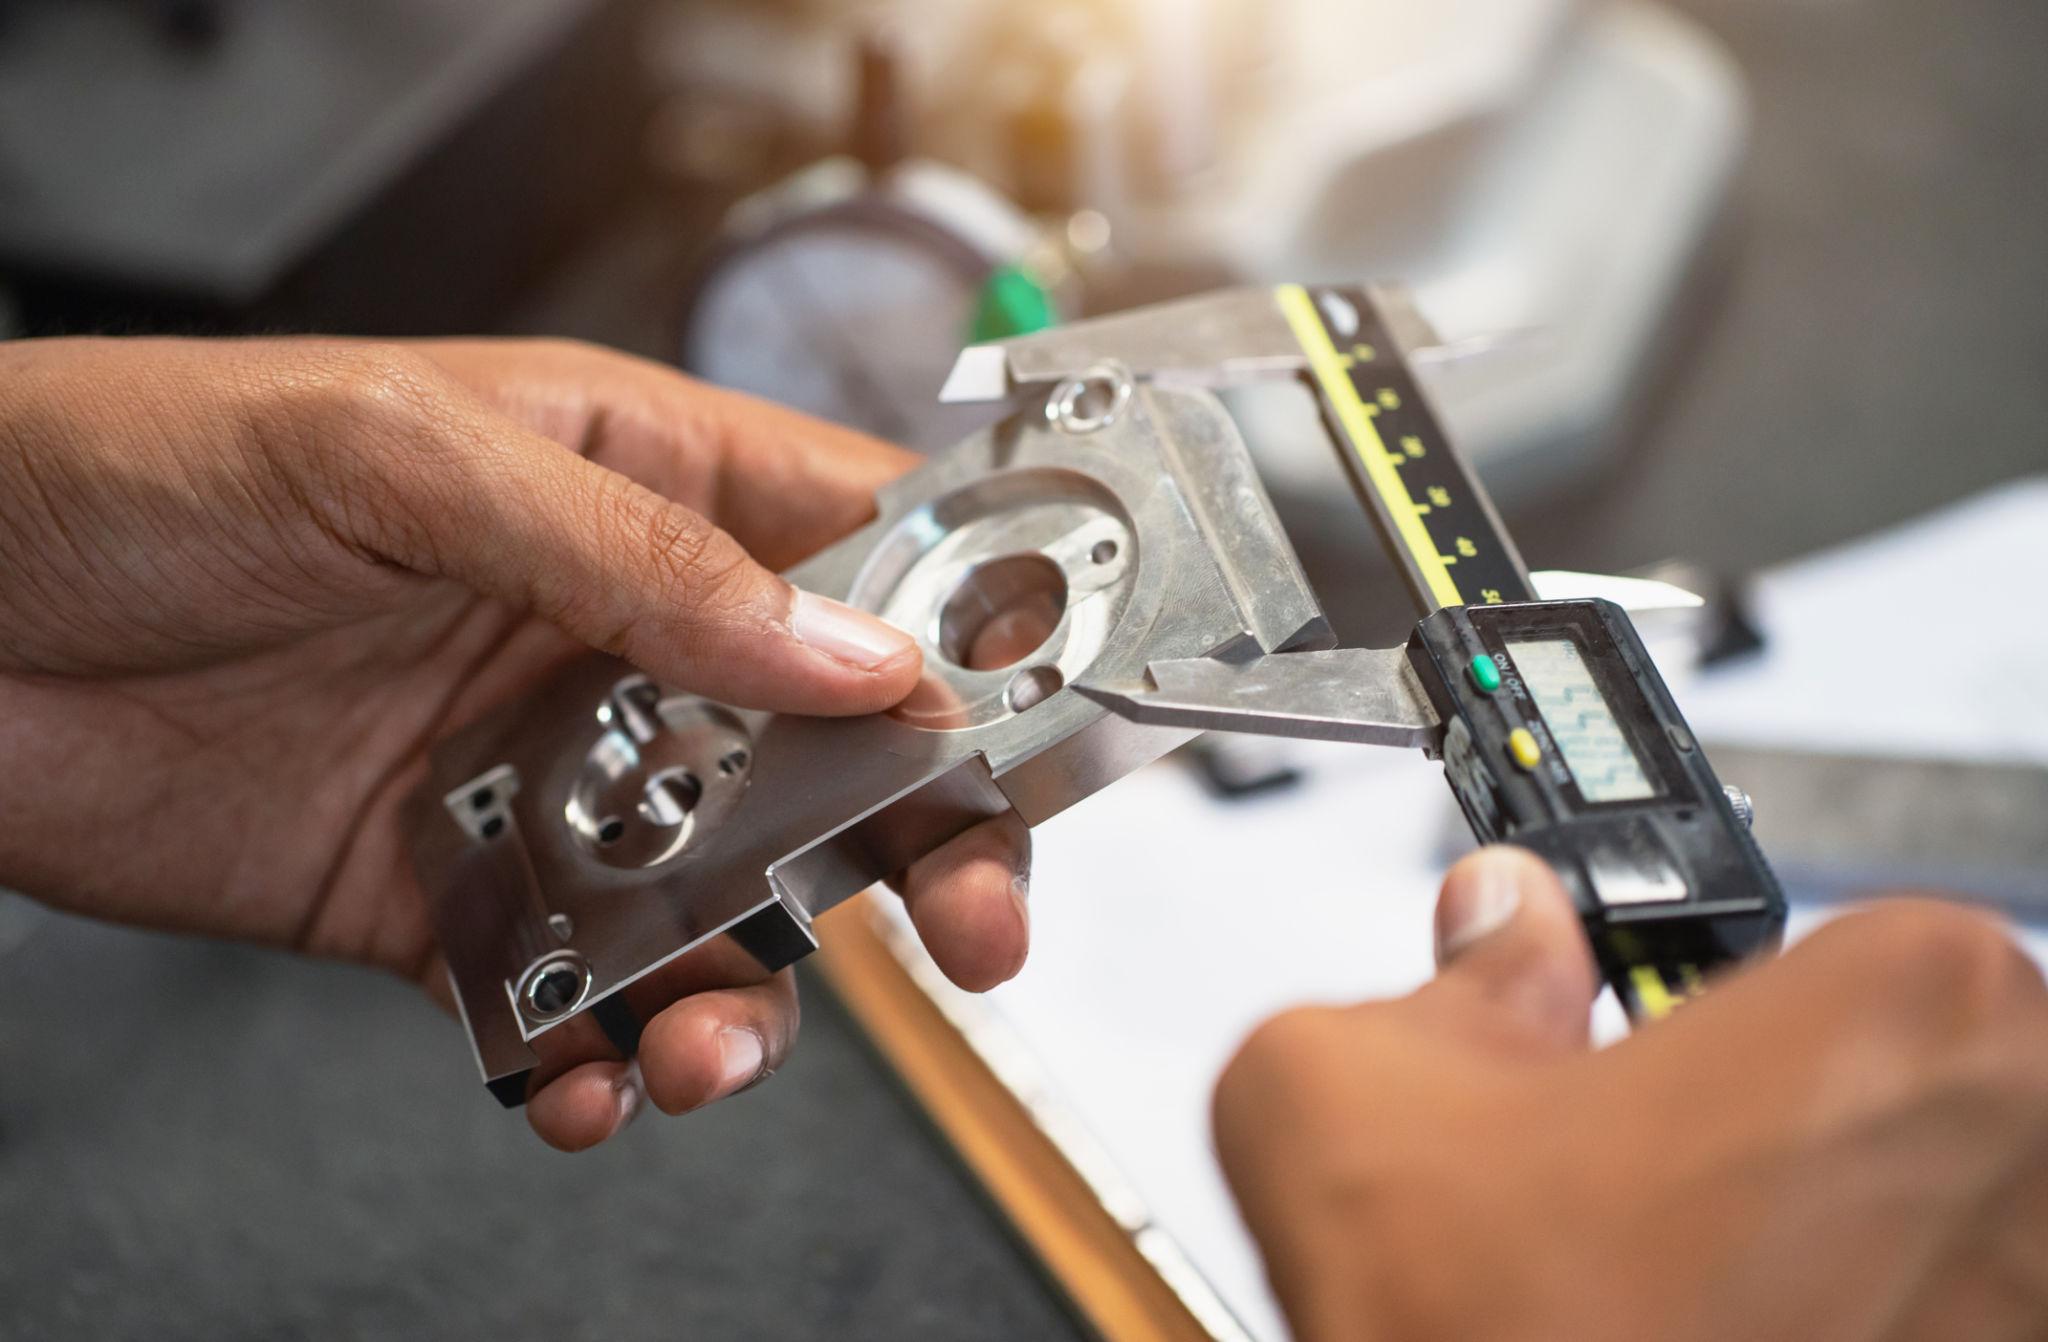
Define the final geometry requirements before you screen alloys. Note critical dimensions, tolerance bands, and surface finish targets. These values determine how much CNC finishing the cast blank needs and which process can hold the specified features. A tolerance stack that demands extensive machining may favor a different alloy and process combination than a part that ships close to net shape.
Compare Alloy Families on Technical Fit
With your requirement list in hand, you can now rank alloy families against it. Technical fit covers four dimensions: mechanical properties, corrosion resistance, thermal and electrical behavior, and castability. Judge each candidate on all four. A strong score in one area rarely compensates for a weak score in another.
Mechanical Properties
Strength and ductility form the first filter. Pull the published values for each candidate grade and compare them against the loads you recorded earlier. The table below gives a useful starting reference for three common casting alloys.
| Alloy | Tensile Strength (UTS, ksi) |
|---|---|
| Aluminum A356-T6 | ~40 |
| Ductile Iron (A536 65-45-12) | 65–100 |
| Stainless Steel CF8M | ~75 |
Ductility deserves equal attention. Gray iron behaves as a brittle material with elongation under 1%. Ductile iron and steels show elongation in the 3–18% range. A part that must bend before it breaks needs a ductile grade. A part that must hold a rigid shape under compression can accept a brittle one.
Alloys like A356 provide exceptional ductility and strength after T6 heat treatment. Ductile (nodular) iron incorporates spherical graphite nodes, giving components yield strengths comparable to carbon steel with lower production costs and superior machinability.
Heat treatment changes the picture. The same alloy can deliver very different properties in different temper conditions. Specify the temper along with the alloy grade. A356-T6 and A356-F are not interchangeable in a structural application.
Corrosion Resistance
Corrosion performance separates alloy families more sharply than strength does. The table below summarizes how the main casting families behave.
| Alloy | Corrosion Resistance / Behavior |
|---|---|
| Aluminum | Forms a natural oxide layer; suitable for automotive and marine parts |
| Copper casting alloys (bronze, brass) | Solid resistance against seawater and many chemicals |
| Stainless and nickel-based casting alloys | Used for harsh chemical and high-temperature environments |
| Gray cast iron | Hard and good for wear surfaces, but brittle; no direct corrosion comparison given |
Aluminum resists marine corrosion through a chemical property rather than a coating. It oxidizes almost instantly to form a hard, thin, tightly bonded aluminum oxide layer. That layer seals the base metal and renews itself when damaged. Steel and iron behave differently: rust puffs up, cracks, and continually exposes fresh metal to attack. Aluminum also offers a weight advantage and strong general corrosion resistance. Stainless steel may be preferred where higher strength or resistance to specific wear forms is needed.
Alloying elements do much of the work here. Chromium, nickel, and molybdenum are the primary means of boosting corrosion resistance in casting alloys. Match the alloy chemistry to the specific corrosive agent, not to a general label like "corrosion resistant." Chloride-rich conditions, for example, stress different alloys than dilute acids do.
Thermal and Electrical Conductivity
Conductivity matters for heat sinks, housings around electronics, and any part that manages heat flow. The values below show how far apart the families sit.
| Metal | Thermal Conductivity (W/m·K) | Density (g/cm³) | Relative Cost | Best Application Fit |
|---|---|---|---|---|
| Silver | 420-430 | 10.5 | Very High | Specialized electronics, high-end contacts |
| Copper | 380-400 | 8.96 | Medium-High | High-power CPUs/GPUs, EV inverters, liquid cold plates |
| Aluminum (Pure) | 205-237 | 2.7 | Low | Heat exchangers, LED cooling, general thermal management |
| Aluminum (6061-T6) | 151-167 | 2.7 | Low | Structural heat sinks, enclosures requiring both strength and cooling |
| Brass | 109-120 | 8.5 | Medium | Decorative heat sinks, corrosion-resistant fittings |
| Carbon Steel | 45-55 | 7.85 | Low | Structural components where thermal transfer is secondary |
| Stainless Steel (304) | 14-16 | 7.9 | Medium | Corrosive environments, food processing, medical equipment |
| Titanium | 17-22 | 4.5 | High | Aerospace, marine, biomedical implants |
Within aluminum, the alloy series spread widely as well. The chart below shows typical values across six series.
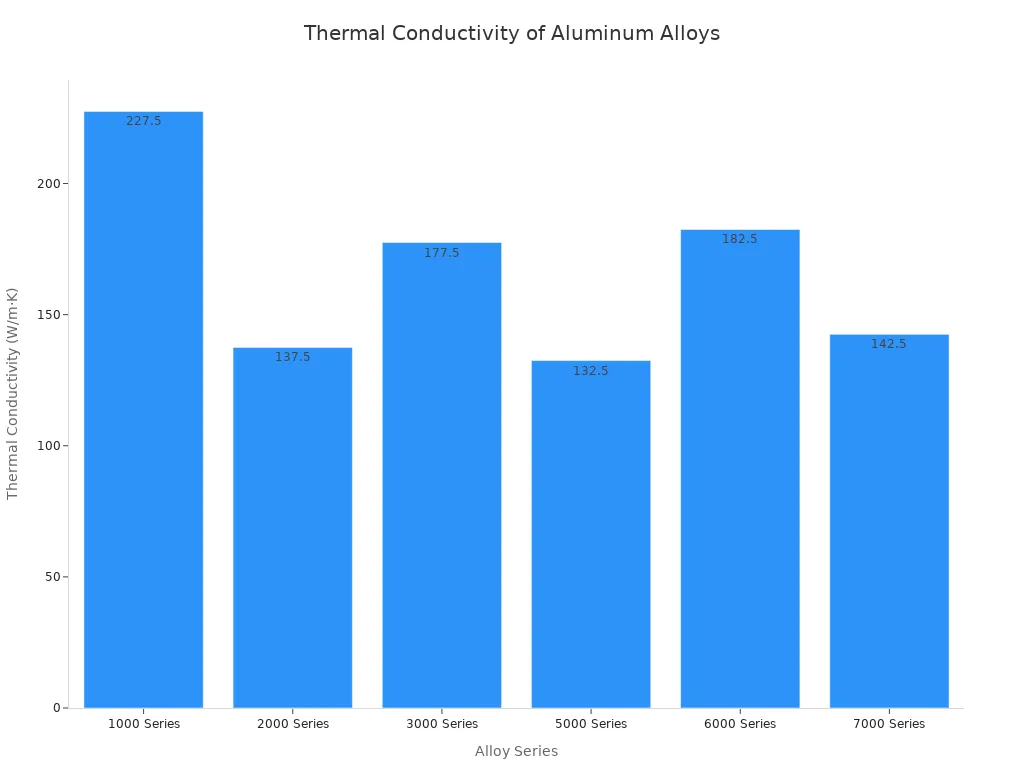
The underlying physics is simple. Thermal conductivity in metals depends on free electrons moving through the crystal lattice. Alloying elements scatter these electrons and reduce heat flow. The 1000 series (99%+ pure aluminum) achieves the highest conductivity at 220-235 W/m·K, but it is soft and weak. Manganese is most damaging to conductivity. Copper adds strength but noticeably reduces conductivity (2000 series: 120-155 W/m·K). Magnesium has a moderate impact (5000 series: 125-140 W/m·K). Silicon combined with magnesium in the 6000 series balances conductivity (150-215 W/m·K) with useful mechanical properties. The 7000 series (Zn-Mg-Cu) has the lowest conductivity among common alloys (130-155 W/m·K) but the highest strength. For 6061 specifically, annealed 6061-O is ~180 W/m·K, 6061-T4 is ~154 W/m·K, and 6061-T6 is ~151-167 W/m·K. 6063 achieves higher conductivity (~200-215 W/m·K) than 6061 with lower strength, making it preferred for heat sink extrusions and LED housings. For electrical components, the 1000 series leads in both thermal and electrical conductivity, making it ideal for bus bars and electrical heat sinks.
Copper wins on pure thermal performance (380-400 W/m·K) but aluminum wins on thermal performance per unit weight (205-237 W/m·K at 2.7 g/cm³ vs. copper's 8.96 g/cm³). Aluminum heat sinks suit moderate heat loads around 150-200W in cost-sensitive products, while copper becomes essential for high heat flux applications exceeding 200W. Aluminum alloys offer roughly 50-60% of copper's thermal conductivity, which proves advantageous in heat exchangers, evaporators, and automotive radiators precisely because weight savings multiply across entire vehicle systems.
Use these rules of thumb to narrow the field:
- Choose copper when heat flux density exceeds 200W in concentrated areas, direct die attachment requires maximum thermal transfer, weight constraints are secondary to thermal performance, and budget allows for premium material and machining costs.
- Choose aluminum when weight reduction matters (aerospace, portable devices, automotive), cost-effective high-volume production is essential, complex fin geometries benefit from extrusion manufacturing, and moderate heat loads (under 150-200W) don't demand copper's premium performance.
- Consider steel or titanium when thermal management is secondary to structural requirements, corrosive environments demand specific material resistance, and regulatory requirements (medical, food processing) dictate material choices.
- Use a hybrid approach to combine copper bases for rapid heat spreading with aluminum fins for lightweight dissipation, capturing benefits of both metals while managing weight and cost.
Castability and Process Compatibility
The best alloy on paper fails if your process cannot pour it reliably. Castability covers fluidity, shrinkage tendency, melting temperature, and oxidation sensitivity. The table below maps the main families to their compatible processes.
| Alloy Family | Castability Rating / Notes | Compatible Casting Processes |
|---|---|---|
| Ferrous (carbon steel, alloy steel, stainless steel) | More difficult than iron due to higher melting temperature and shrinkage tendency | Sand Casting, Investment Casting, Vacuum Casting |
| Aluminum alloys (Al-Si, Al-Cu, Al-Mg, Al-Zn) | Excellent fluidity and castability; suitable for thin-wall and complex components | Die Casting, Permanent Mold Casting, Sand Casting, Investment Casting |
| Copper alloys (brass, bronze, Cu-Ni) | Good castability but requires oxidation control during melting and pouring | Sand Casting, Centrifugal Casting, Permanent Mold Casting |
| Magnesium alloys (Mg-Al-Zn, Mg-RE) | Good castability but requires protective atmosphere due to oxidation sensitivity | Die Casting, Permanent Mold Casting, Sand Casting |
| Titanium alloys (Ti-6Al-4V) | Difficult to cast due to high melting temperature and chemical reactivity; requires controlled environments | Investment Casting, Vacuum Casting |
| Nickel-based superalloys (Inconel, Hastelloy, Rene) | Challenging; requires precise temperature control and advanced molds | Investment Casting, Vacuum Casting |
| Precious metals (gold, silver, platinum, palladium) | Generally good castability but requires precise control for high-quality surfaces | Investment Casting, Centrifugal Casting |
| Special engineering alloys (cobalt-based, tool steel) | Require advanced casting techniques due to alloy complexity | Investment Casting, Vacuum Casting |
Process choice narrows the alloy list quickly. Die casting uses pressure to inject molten metal into a steel mold but can only use low melting point (non-ferrous) alloys. Ferrous metals' higher melting points limit die life, so ferrous alloys are generally excluded from that route. Investment casting is described as limitless in terms of alloy choices, supporting use across ferrous, nickel-based, titanium, and precious metal families. It suits intricate, tight-tolerance small-to-medium parts, and its key advantage is the ability to work with ferrous metals, especially stainless steel and heat-resistant alloys. Sand casting is highly versatile in sizes, shapes, and materials, giving broad alloy compatibility.
Match the process to the part geometry as well. Thin walls and complex cavities reward alloys with excellent fluidity, such as the aluminum family. Heavy sections in ferrous alloys demand generous feeding and shrinkage control. A castability review with your foundry at this stage prevents a technically ideal alloy from becoming an unmakeable part.
Screen for Compliance, Cost, and Validation
Technical fit narrows your candidate list. Compliance, cost, and validation decide which candidate you actually release to production. Treat this stage as a filter with a fixed order. Each screen removes options and protects the next decision from rework.
Standards and Certifications
Compliance is not a paperwork formality. It is the evidence trail that proves your alloy choice meets the market your part serves. Start by mapping the standards that apply to your program, then confirm your supplier holds the certifications to support them.
| Standard / Certification | Scope in OEM Metal Casting | Key Quantitative Requirement / Benchmark |
|---|---|---|
| ISO 9001 | Quality management system baseline for die casting factories | Standardized workflows to reduce defects and maintain consistency |
| IATF 16949 | Automotive-grade quality extending ISO 9001 with risk management, traceability, defect prevention | Cpk ≥ 1.67; defect rates below 0.5% in high-volume runs; ~40% faster PPAP |
| NADCA | Aluminum/zinc die casting benchmarks for surface finish, porosity, dimensional accuracy | Surface roughness < 3.2 μ Ra; porosity < 1.2% by volume; tolerances as tight as ±0.05 mm; melt temp within ±5°C |
| ASTM B85 | Aluminum alloy integrity for die casting | Tensile strength ≥ 310 MPa; elongation ≥ 3% |
| MIL-STD-2175 | Military-grade material performance under combat conditions | Salt spray corrosion testing > 1,000 hours |
| ASTM E2931 | Process validation (temperature/pressure records) | Documented production temperature and pressure compliance |
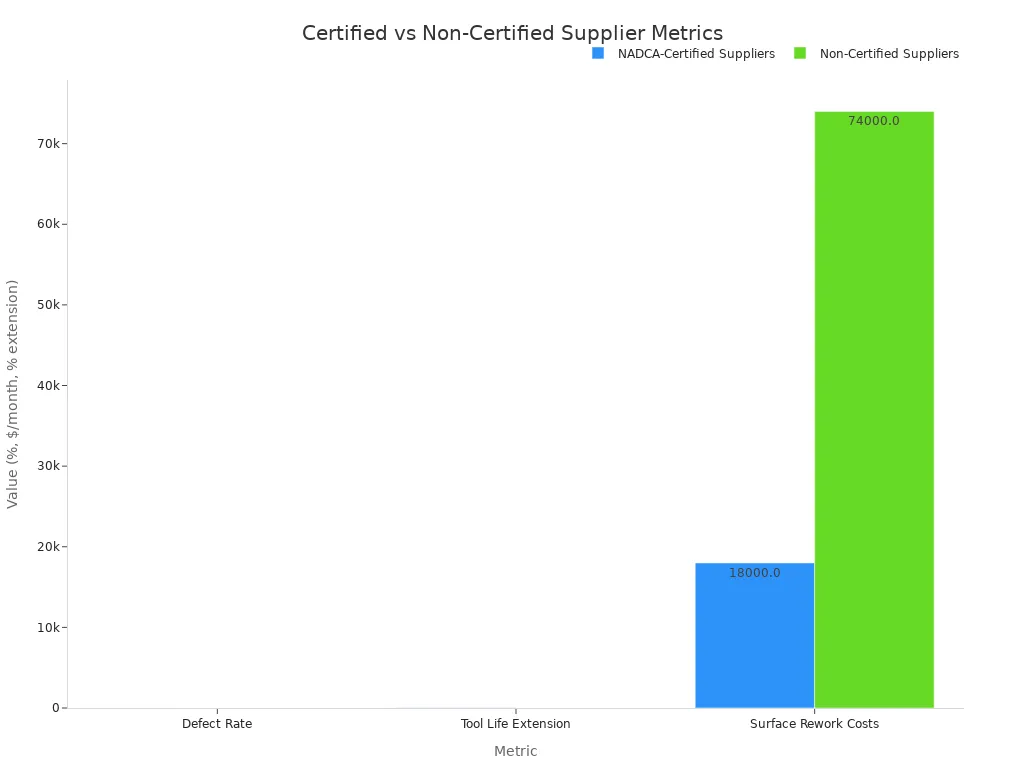
The certification gap shows up in hard numbers. NADCA-certified suppliers run a 0.8% defect rate against 4.1% for non-certified shops. Tool life extends by 35%, and monthly surface rework costs fall from $74k to $18k. First-pass yield reaches 98.2% with NADCA-compliant lubrication. A 2023 audit of 47 suppliers found that NADCA-certified factories cut dimensional non-conformities by 62%. Prioritizing ISO 9001 and IATF 16949 suppliers reduced quality incidents by 34%. Dual ASTM B85 plus MIL-STD-2175 compliance produced roughly 42% fewer dimensional deviations than ISO-only suppliers.
Build a supplier audit checklist around these proof points:
- Review Design of Experiments (DOE) for gating systems as part of process validation
- Audit material traceability from alloy certificates through heat-treat logs
- Analyze 8D reports for porosity defects as corrective-action evidence
- Confirm die casting cell process capability indices (Cpk ≥ 1.67)
- Verify spectrometer checks of metal composition for every batch via mill test reports (MTRs)
- Require X-ray inspection covering at least 95% of casting area for critical parts
- Check documented temperature/pressure records per ASTM E2931
Match the standard to the end market. A pump housing for general industry may need only ISO 9001 and ASTM B85. A compressor component bound for an automotive assembly line needs IATF 16949 with Cpk evidence. A defense or marine part may require MIL-STD-2175 salt spray data beyond 1,000 hours. Over-specifying certifications adds cost without value. Under-specifying them creates rejection risk at the customer's receiving dock.
Total Cost of Ownership
Purchase price per pound is the weakest cost signal in alloy selection. Total cost of ownership (TCO) captures every cost the part generates across its service life. Build the number in five steps:
- Procurement (material) costs — raw material quantity × price per unit, plus transport and handling. Example: 0.5 lb brass at $3.00/lb = $1.50 material + $0.50 transport = $2.00.
- Operational (processing) costs — machining time × machine rate, plus labor. Example: 30 min at $50/hr = $25.00 machining + $10.00 labor = $35.00.
- Maintenance and replacement costs — tool wear amortized per part plus machine maintenance allocated per part. Example: $200 tool ÷ 1,000 parts = $0.20 + $1,000/yr ÷ 2,000 parts = $0.50, totaling $0.70.
- End-of-life and scrap recovery — recycling value credited against cost. Example: net recovery of $0.10 per gear (subtracted).
- Total cost of ownership = procurement + operational + maintenance − end-of-life recovery = $2.00 + $35.00 + $0.70 − $0.10 = $37.60 per gear over 5 years.
The lifecycle view changes the ranking of candidates. Consider a $150 gear with a $50 installation. Regular maintenance at $30 across 10 biannual sessions adds $300. Unexpected repairs at $100 across about 2.5 incidents add $250. One replacement at end of lifespan adds $200. Downtime at $500/hr across 4 hours and 12.5 sessions adds $25,000.
| Cost category | Basis of calculation | 5-year cost |
|---|---|---|
| Initial (purchase + installation) | $150 gear + $50 install | $200 |
| Regular maintenance | $30 × 10 biannual sessions | $300 |
| Unexpected repairs | $100 × ~2.5 incidents | $250 |
| Replacement at end of lifespan | $150 gear + $50 install | $200 |
| Downtime (indirect) | $500/hr × 4 hr × 12.5 sessions | $25,000 |
| Total lifecycle cost | Sum of all categories | $25,950 |
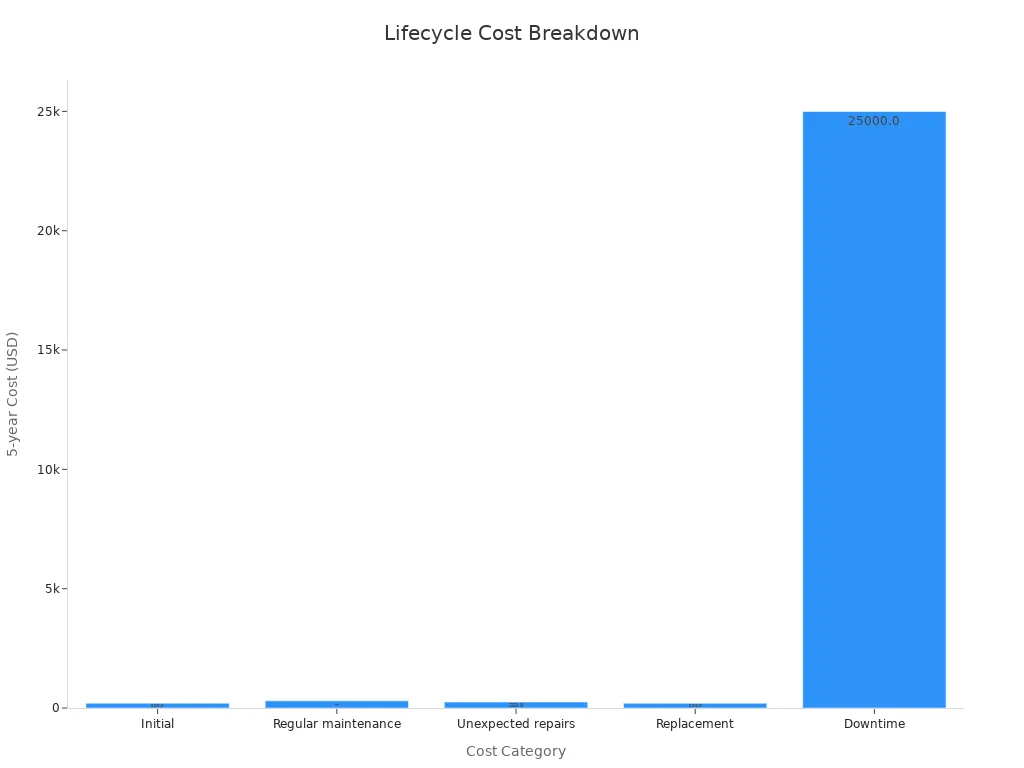
A $150 part accumulates $25,950 over its life. Indirect downtime dominates the total. This is why lifecycle cost, not purchase price, must anchor your alloy decision. A slightly more expensive alloy that resists wear or corrosion can eliminate repair incidents and downtime hours worth many times its premium.
Several levers reduce TCO without compromising the part:
- Scrap recycling: recycled brass is cheaper than virgin brass and retains desirable properties, lowering both material cost and environmental impact.
- Optimized nesting software: reduces raw material usage by improving part layout, directly cutting material cost per unit.
- Quality control trade-off: rigorous QC raises upfront cost but reduces defect, rework, and scrap losses. One case study showed a 15% upfront cost increase yielding 50% fewer defect losses.
- Material price volatility: long-term supply contracts, alternative or recycled sources, and design efficiency mitigate raw-material cost swings that propagate through the whole lifecycle.
Watch the alloy premium against necessity. Specialty grades such as 7075 cost 50–60% more than standard 6063. Over-specifying adds cost without value. Under-specifying creates failure and liability costs. Load requirements, surface-finish expectations, geometry complexity, and corrosion exposure all influence which alloy minimizes total cost. Scrap value varies by grade as well. Clean 6061 and 6063 extrusion scrap commands premium prices, around $0.62/lb for TATA 6063 and $0.60/lb for Clean 10/10, against $1.17+/lb for new material. Higher-value alloys retain their relative premium in scrap markets, partially offsetting initial cost. Painted or mixed scrap is worth 30–40% less than clean grades, so keeping scrap clean protects recovery value. Finishing deserves the same lifecycle lens. A mill finish may save $0.30/kg upfront but need replacement in 5 years, while anodizing lasts 20+ years. Evaluate the true cost over service life.
Testing and Quality Assurance
Validation converts assumptions into evidence. A qualified alloy is one that passed defined tests on defined samples at defined frequencies. Plan the test program before the first pour, and specify which methods apply to which part criticality.
| Category | Testing Method | What It Validates |
|---|---|---|
| Destructive | Charpy V-Notch Impact Testing | Measures energy absorption under sudden force (e.g., cold service conditions) |
| Destructive | Hardness Testing (Brinell/Rockwell C) | Resistance to indentation; leaves small permanent mark |
| Non-Destructive | Dye Penetrant Inspection | Surface cracks and porosity via liquid dye |
| Non-Destructive | Radiographic Inspection | Internal structure — shrinkage, porosity, inclusions below surface |
| Non-Destructive | Ultrasonic Examination | Subsurface cracks, voids, inclusions via high-frequency sound waves |
| Non-Destructive | Dimensional & Layout Inspection | Verifies critical dimensions/tolerances against drawing |
| Non-Destructive | Chemical Analysis (optical emission spectrometer) | Confirms alloy composition and carbon content within spec |
Non-destructive testing (NDT) protects the part without destroying it. Radiographic testing uses X-rays or gamma rays to detect internal flaws. Ultrasonic testing sends high-frequency sound waves to identify defects. Magnetic particle inspection finds surface and near-surface cracks in ferromagnetic materials. Liquid penetrant inspection uses dye to highlight surface cracks and discontinuities. Visual inspection catches surface defects by eye or under magnification. Eddy current testing uses electromagnetic induction to detect surface and near-surface flaws.
Destructive testing proves the material itself. Tensile testing measures reaction to being stretched until break. Impact testing measures energy absorption under sudden force. Hardness testing measures resistance to deformation by indentation. Fatigue testing measures endurance under repeated cyclic stresses. Corrosion testing measures resistance under specific environmental conditions. Fracture and mechanical testing reveal behavior under bending, shearing, and torsion.
Organize the full program by testing area:
| Testing Area | Methods |
|---|---|
| Mechanical Testing | Tensile (ambient/elevated), Impact/Charpy, Brinell & Rockwell hardness, Stress rupture |
| Chemical Analysis | Carbon sulfur determinator, Optical emission spectrometry, Phase examination, X-ray fluorescence |
| Dimensional Testing | Visual inspection, NIST-traceable metrology, CMM, Laser scanning |
| Non-Destructive Testing (NDT) | Fluorescent/liquid penetrant inspection, Magnetic particle inspection, Hydrostatic testing, Positive material identification, Radiography (x-ray) |
Set sampling frequency by criticality. Safety-critical and pressure-retaining parts warrant 100% radiographic or ultrasonic coverage of critical zones, plus per-lot tensile and chemical checks. General structural parts can run per-lot chemical analysis and hardness with dimensional layout on first article and periodic audits. Every batch should carry a mill test report (MTR) tied to the heat number, and every shipment should carry production records and inspection reports for traceability.
Qingdao Xuxiangtai supports this validation stage with casting process design, mold development, casting simulation, and defect control. The engineering team reviews drawings and tolerances, runs prototype trial production before mass production, and provides production records, inspection reports, and material test records as required. Post-processing options include heat treatment, shot blasting, surface finishing, dimensional inspection, and material testing, so the cast blank and its verification data arrive together.
Bring your drawing, sample, or technical specification to the alloy conversation early. Submit your STEP or IGS files and material requirements for evaluation, and the engineering team will help you screen candidates against compliance, cost, and validation before the first casting is poured.
Define requirements first. They anchor every later decision. Then screen candidates in a fixed order: properties, compliance, cost, castability, and testing. Bring your foundry into the alloy conversation early. This professional English B2B educational article for Qingdao Xuxiangtai Machinery Manufacturing Co. shows how early collaboration shortens the path from drawing to qualified part. Submit your drawings, samples, or technical specifications to Qingdao Xuxiangtai Machinery Manufacturing Co. for evaluation, and let this professional English B2B educational article for Qingdao Xuxiangtai Machinery Manufacturing Co. guide your next alloy decision.
FAQ
How do you choose between aluminum and gray iron for a mechanical housing?
Match the alloy to your load and weight targets. Aluminum cuts mass and machines easily. Gray iron delivers vibration damping and wear resistance. Compare both against your requirement list before you decide.
When should you bring the foundry into the alloy discussion?
Involve the foundry during requirement definition, not after you finalize the drawing. Castability, shrinkage control, and process fit need supplier input. Early review shortens the path from drawing to qualified part.
What do you do when an alloy passes property checks but casts poorly?
Revisit the process before you reject the alloy. Adjust gating, feeding, or pouring temperature with your foundry. A castability review often rescues a technically strong candidate.
See Also
Avoid Making Incorrect Aluminum Casting Process Decisions Ever Again
https://www.xuxiangtaimetal.com
Qingdao Xuxiangtai Machinery